


Introduction
In a previous four-part series of articles on computer audio we described a variety of factors that influence sound quality (abbreviated as SQ throughout this article) of digital music files (see TAS, December 2011 through March 2012; issues 218, 219, 220, and 221). We introduced a method by which a reader could replicate a reviewer’s audio testing experiences on his own system. Although this method was subjective, it was based on a series of very specific performance criteria (defined in part 1, issue 218) which could be quantified by a sonic measurement scale. This scale was defined as the difference in perceived sound between a CD and a high-resolution download or an SACD, both derived from a common master recording. In this way readers could replicate our experiments with their own equipment and subjectively hear what we heard. They could then judge for themselves the quantitative significance of our results as modified by their own system quality and perceptual skills.
In Part 1 of this new three-part series of articles, we introduce further refinements to our method of sonic evaluation. In the course of developing these improvements, we have identified what we believe to be an even better way to make sonic judgments. This new method can legitimately be considered objective, or at least quasi-objective, as compared to familiar subjective approaches. Among the benefits of this new method are its time-independence from one listening session to the next and a way of independently verifying subjective evaluation. For the first time anywhere, we present data that support this discovery. In Part 2 we provide three examples showing how these new methods can be used to determine the effect of three variables on system SQ: 1) effects of degree of FLAC compression on subsequent playback quality; 2) a surprising and inexpensive tweak which improves the sound of any high-quality audio system; and, 3) comparison of the effects of different equipment footers on the performance of a digital-to-analog converter. In Part 3, we use these methods to tackle the question of which is the better music server system, Mac or PC.
In our earlier articles on computer audio, we obtained some results which were a bit vexing and which we could not explain. In particular, we found that FLAC and WAV files did not sound the same. We also found that conversion of WAV to FLAC and back to WAV, particularly at CD-quality resolutions, also sounded different. In both cases, we found degradation of audio quality, despite the fact that all files we used were bit-identical. Some have suggested that such results could be explained by so-called “expectation bias.” We feel this possibility was excluded by strict adherence to the controlled, single-blind testing procedures we used throughout our listening tests. Some readers took issue with our methodology for quantifying the sonic differences and completely misunderstood the point of our measurement scale.
Despite theoretical criticisms leveled at our work and despite those who were unable to replicate our findings, many people did successfully reproduce and confirm our results. Now, some two-and-a-half years later, explanations for our observations are beginning to emerge involving conventional and non-conventional sources of jitter and additional, complex computer operational influences. We are gratified to see HDtracks change its policies and offer WAV downloads in addition to the normal practice of supplying compressed file formats. We hope that other vendors will follow this practice. There is also an indication that some download sites may be reducing FLAC compression ratios for improved sound. In addition to these changes in industry practice, we have been told that our results have had a marked positive effect on at least three software companies, and we have received compliments from many manufacturers around the world for the beneficial influence our article has had within the audio industry.
Description of Test Systems
System 1 – The signal path was computer server to M2Tech USB-to-SPDIF converter to PS Audio Perfect Wave DAC Mark II (PWD) to BSG qølTM processor to monoblock NuForce Ref 9SE V3 amplifiers to B&W 802 Diamond speakers. The processor also fed a pair of Velodyne ULD15-II subwoofers in parallel with the main speakers. All equipment was positioned on granite shelves supported by sand-filled steel stands. Cabling from the computer to the M2Tech was Wireworld Platinum. All other cables (interconnects, speaker, power and SPDIF) were from Exakte Audio Conductor which was chosen after comparison with a number of other brands because of its roughly 3 to 4 times greater performance-to-cost ratio over many other well-known brands. The SPDIF cable, which was 20 feet in length, was terminated with a custom-made adaptor in which the ground was isolated by a coupling transformer. AC power to the audio components was supplied from a 20-amp dedicated circuit which fed a PS Audio Power Plant Premier AC voltage regenerator/line filter. The computer was powered from an independent, dedicated 20-amp circuit. The PC used as a server consisted of a Gigabyte X58A-UD3R motherboard with 12GB of RAM, an Intel Quad Core i7 3.2GHz processor, and a 650W internal power supply in an Antec full-size tower case. It is important to note that this computer was dual purpose, acting both as a primary desktop computer and as a music server. As a result, additional hard drives, programs, and background functions were frequently running in addition to the software that supported the music server function. The operating system initially was Windows 7 Pro (64-bit) and was later upgraded to Windows 8 Pro (64-bit). The computer was supported by Nordost Bronze Sort Kones over a 2cm-thick granite base and powered with an Exakte Audio Conductor AC cable. Each of these external additions to the computer were tested individually and found to improve the sonic characteristics of the computer acting as music server. JRiver Media Center (JRMC) v. 18, and later v. 19, was used throughout the testing for music playback, with care taken to optimize all relevant output settings. Dimensions of listening room 1 measure ~32’x20’x7′, with the speakers placed ~8′ apart (center to center), ~5′ out from the front of the room, the left speaker ~5′ away from the left side wall, and the right speaker ~7′ away from the right side wall.
System 2 – The signal path was dedicated computer server to asynchronous USB input on a PWD-II to BSG qølTM processor to mono-block NuForce Ref 9SE V3 amplifiers to Paradigm Signature S8 speakers. The processor also fed a pair of Velodyne SF15 subwoofers in parallel with the main speakers. The computer was connected to the PWD by a 1m long Wireworld Platinum USB cable. All other cables (interconnects, speaker and power) were from Exakte Audio Conductor. AC power to the audio components and computer was supplied from a 20-amp dedicated circuit which fed a PS Audio Perfect Wave Power Plant P3 AC voltage regenerator/line filter. The computer server used in this system consisted of an Asus P5K Deluxe motherboard with 6GB of RAM, an Intel Q6600 2.4GHz processor, and a 650W internal power supply in a Silverstone horizontal case. All of the equipment used in this system was supported on granite on steel shelves. Initially, Nordost Bronze Sort Kones were used under each piece of equipment. These were later replaced with Stillpoint Ultra Mini SS footers. The Windows 7 Pro (64-bit) operating system was initially used for listening tests and later upgraded to Windows 8 Pro (64-bit). A 500GB internal HD was dedicated for programs (later upgraded to a 240GB SSD when Windows 8 was installed) and a 1.5TB internal HD dedicated for music. This server was loaded only with the necessary software required to support the music server function. As in system 1, JRMC (v. 18 and later v. 19) was used as the primary playback software. Dimensions of listening room 2 measure ~23’x13’x7.5′, with the speakers placed 6.5′ apart (center to center), 4’10” out from the front of the room, and 3′ from the side walls.
 and M-Bit+™ proprietary dither was added as a matter of course using the same software. CD ripping to the hard drive was performed using dBPowerAmp v.14.4 (dBPA). Up-conversion of the CD is indicated in red and downconversion of the 192/24 high resolution file is indicated in green. Bit depth is shown for each sampling standard and was always 24 bits except for the initial CD rip. An Acousence recording of Chabrier’s España, track 1 (Acousence ACO -DF 41610) originally recorded at 192/24 (available as a DVD -R) and the commercially produced CD down-sampled from the high-resolution master were sources of the files we used to create this scale.")
Results – Measurement Advances
Establishment and Description of a Better Measurement Scale for Estimating Sound Quality Differences
The sonic scale we created in our previous article (described in the Introduction section above) was based on a starting reference SQ of a CD played back from a PS Audio PWT transport compared with a high-resolution standard derived from the same master. We have revised the scale as illustrated in Figure 1 in view of the now more common practice of ripping CDs directly to a hard drive in WAV format. This has the advantage of rendering the scale more independent of the vagaries of different CD players or transports. This ripped file is now set to an arbitrary 100 points in SQ on this revised scale which allows for estimates of MP3 SQ falling below 100 points.
As described in Part 1 of our previous article on Computer Audio, a course measure of SQ was based on the number of A/B comparisons required to be certain of the differences in all the most important sonic qualities. To discern a small difference in SQ required 4 to 6 A/B comparisons; a medium difference required 3 to 4 comparisons; and a large difference required only 1 to 2 comparisons. In that article we chose a measurement scale that could be replicated by any reader on their own systems at home. The starting sonic marker of the scale was the SQ of a CD played back from a PS Audio Transport and DAC. The highest sonic marker was defined as the SQ of the authentic high-resolution filef rom which the CD was derived (available as a download).
We created a series of up-sampled files from the ripped CD which provided intermediate sonic markers of SQ. The scale was then assembled by subjectively judging the incremental improvement in SQ from one sonic marker to the next. Initially a “small” SQ difference was defined as a 10 point improvement, a “medium” SQ difference was defined as 20 points, and a “large” SQ difference was defined as 30 to 50 points. With the recording we used to conduct these tests, our scale spanned from an arbitrary 100 points for the CD up to 180 points for the high-resolution download. However, we felt there was a degree of uncertainty in our judgments when the difference between sonic standards was larger than 30 points. Therefore, for this article we created a series of closely-spaced SQ standards by either up-sampling the CD rip to all resolutions possible up to 192/24, or down-sampling the original native 192/24 high resolution recording to all possible lower resolutions. The choice of the recording we used was also quite important (as will be made clear in Part 2 of this article). We made extensive use of a modern performance of Chabrier’s España released in 2010 by Acousence in Germany (ACO-DF-41610) and an older, standard-resolution, but excellent remastered recording of Ramirez’ Misa (LIM K2HD 040, UD). For various reasons, these were much better than the Reference Recordings Rachmaninoff Symphonic Dances we used in our earlier articles (see below).
As illustrated in Figure 1, by combining all possible up-converted files made from the ripped CD with all down-converted files made from a high-resolution 192/24 download, we created a scale extending from 100 to 210 points, with the largest increment in SQ no greater than 20 points. This 20 point interval between sonic standards was well within the accurate range of our subjective sonic judgment. Readers can construct their own sonic standards and measurement scales with the equipment they own regardless of whether their system is better or worse than ours. They can then know subjectively the significance of our results within the context of their own equipment, environment and listening acuity.
 or a Reference Recording of Rachmaninoff Symphonic Dances (track 6, RR 96, purported to be a 176.4/24 WAV file copy of the mastertape copied from an HRx disc to the hard drive) were used for these experiments. Down-sampling of the high-resolution files is indicated by solid lines; up-sampling from the ripped CD is indicated by dashed lines; Acousence files are shown in red; Reference Recordings files are shown in black. Fig. 2A. All data points for each line were used to plot the most accurate slopes. Fig. 2B. Data points were divided into two groups with one set derived from the 44.1kHz clock frequency and a second set derived from the 48kHz clock frequency. Best fit separate lines were drawn for each set of data.")
The improved scale shown in Figure 1 was created shortly after publication of the fourth installment of our previous article on computer audio (Issue 221). Without any expectation bias, we used this scale to evaluate the effect of sample-rate conversion on SQ. Sometime later, we tried plotting these subjective numerical scores as a function of either up-sampling from a ripped CD or down-sampling from a high-resolution file copied from a commercial DVD-R. When plotted on a semi-logarithmic scale, although there was some data scatter as would be expected, we were quite surprised to find a fairly obvious linear relationship between the degree of up-or down-sampling and our subjective SQ judgment. These results are illustrated in Figure 2A.
As we pondered the significance of these observations, it became obvious that a subtler pattern was buried in this data. No matter how many times we repeated these experiments, the semi-log plots consistently displayed a pattern in which every SQ score that was a multiple of a 48 kHz sampling frequency fell above our original best fit line; conversely, every SQ score derived from multiples of 44.1kHz sampling frequency fell below the line. We then re-plotted the data treating each sampling series independently. Much to our astonishment, the data points now showed virtually no scatter, or at least, very, very minimal scatter and a surprisingly precise linear relationship between our subjective scoring method and sampling frequency. These re-plots are shown in Figure 2B.
Several important points may be drawn from these data.
- These results show the consistency and reproducibility of our subjective method for reliably detecting sonic differences.
- The results shown in Figure 2B illustrate the very significant and useful sonic improvement that can be achieved with up-sampling. Ripping CDs followed by up-sampling improves the original SQ and provides enhanced value to an existing CD collection. Up-conversion of sampling frequency per se can add no new information and cannot modify the bandwidth limits of the original recording. Improvements in SQ clarity under these circumstances are therefore most likely due to a reduction of various forms of filter-induced phase distortion. Up-conversion of bit depth does add more information in the form of more accurate mathematical estimates of volume relationships between musical fundamentals and overtones and would be expected to produce a more authentic sense of “realism” to the brain. Other mechanisms for why up-conversion improves SQ can be hypothesized that may involve reduction of systemic digital artifacts in the processing or transmission of information, ultimately explicable by conventional or non-conventional forms of jitter or S/N interference. Time and further research will be required to explain these results.
- On the other hand, if one were to burn a CD from a legitimate high-resolution file, the down-sampling results illustrated in Figure 2B show that one can create a CD or a 44.1kHz/16-bit file that is significantly better (a good 35 points on our scale) than a modern commercial CD. This might be of value for use in cars, portable music players, or secondary systems.
- The existence of a linear relationship between down-or up-sampling procedures is revealing and provides some justification for commercial claims that up-sampling produces a better SQ akin but not equal to true high-resolution recordings. The industry practice of charging the same price as authentic high-resolution recordings for such artificially-produced better-sounding products is not justified since it possible to achieve the same benefit at home by up-sampling from CDs (at least in our experience using iZotope Adv.). Neither is it justified to charge the same price for transcriptions of analog mastertape digital transfers regardless of degree of up-sampling.
- After hundreds of listening tests using familiar source material, it is apparent that we have achieved a very high level of consistency when using the criteria we deem most significant in making overall subjective judgments. We estimate our subjective accuracy to be on the order of +/-5 points on our scale in Figure 1. We would characterize a 5-point difference as “small”, which would require 4 to 6 A/B comparisons before reaching a consistent judgment. With the number of repetitious listening tests we have run, we can now identify with assurance 10-point differences with a single A/B comparison, although others with less experience with our methods might require 3 to 4 A/B comparisons, a difference we used to call “medium.” “Large” differences of 30 to 40 points might only require 1 or 2 A/B comparisons for most listeners. In our experience, a 20-point difference is now quite easy for us to categorize and can be reliably detected with only one A/B comparison. What we estimate to be a 10-point significant difference under our conditions may well be inaudible on poorer systems or with less experienced listeners. It is also possible the opposite could be true. In either case, readers can compare their results with ours using the same music file standards as we have chosen.
- We considered the possibility that the 44.1 versus 48kHz difference pattern shown in Figure 2B might be related to the oft-assumed superiority of even versus odd-order multiples of the sampling frequency of the original master recording. However, we have rejected this explanation and have concluded that these current results must be an artifact of the clock frequencies of the DAC (recent experiments indicate the effect seems to be independent of the DAC used), an artifact of the internal clocking of the Windows-based PC server we used, or an artifact of the sample rate conversion software. Assuming the recording information published by Reference Recordings is correct, this persistent pattern seems unrelated to the original master recording frequency since the same pattern was observed in both master recordings and CDs derived from multiples of 44.1kHz (Reference Recordings) and 48kHz (Acousence). We are continuing to investigate the source of this effect.
- The significantly large difference in the down-sampling compared to the up-sampling slopes derived from the Acousence recordings can be explained as follows. When reducing the sampling frequency of a high-resolution file, one is actually losing information. Thus, the slope of the down-sampled line is steeper than the slope of the up-sampled line. When up-sampling from a lower to higher bandwidth, no new information can be added or created in the process. That the up-sampled line has a positive slope at all (the sound of ripped CDs improves with degree of up-sampling), we suggest is likely due either to a reduction in the influence of anti-aliasing filters, a reduction in some form of jitter, or possibly an increased immunity of the enlarged file size to the degrading effect of ambient jitter by a mechanism yet to be adequately explained.
- Finally, the shallowness and unusual similarity in the linear slopes of the SQ of either the up-sampled or down-sampled Reference Recording lines plotted in Figure 2B when compared with the Acousence results were unexpected and are suggestive of some problem with this recording.
All of these individual characteristics might well be causally interrelated and represent in each case the degree of low-level information retrieval in a given situation. The idea that a single sonic characteristic may encapsulate all or most of the typical audiophile criteria of SQ is actually not a new concept. Harry Pearson speculated that front-to-back depth alone might represent just such a single figure of merit for a given piece of equipment or system (see Issue 215, page 78). Unfortunately, there is no very good way of accurately measuring depth.
But we believe we have found such a single figure of merit by using height measurements of specific instruments or voices in carefully selected high-quality recordings. After listening to our sonic quality standards again and measuring the height, this method appears to correlate precisely with overall perceived SQ. Fortuitously, the height of an instrument or voice above a baseline height in any given listening environment can easily be measured in inches with a high degree of accuracy. This method has revealed thought-provoking insights into the quality of various recordings. Additionally, it can be applied to gauge the SQ of a variety of system variables. In the following section we present data to support these findings.
Relationship Between Height Reproduction and Up-and Down-Sampling
During the course of our investigation of the effect of up-sampling on SQ, we noticed that certain instruments (for example, the harp in Chabrier’s España, track 1, specifically the harp section from 39 to 45 sec; Acousence ACO-DF 41610) or the ranks of singers, especially the sopranos, in Misa Criolla (track 5, specifically the upper rank of sopranos occurring from 3 min, 12 sec to 3 min, 23 sec; LIM K2HD 040, UD version) seemed to vary in height in accordance with our subjective quantitative scale of SQ. It occurred to us that height alone might represent one of those characteristics that accurately reflect overall recorded quality. Therefore, we repeated our comparative listening tests, but this time attempted to estimate the height of these sonic markers in our standard test tracks. To make this easier, we created a physical scale marked off in 1/2″ increments that hung from the ceiling next to our speakers. The baseline zero height was set to the center of the midrange driver of the B&W 802s. In this way we could visually estimate height in inches of these instruments or voices for the various sampling frequencies. When the height results were plotted among all of these lines suggests that we are indeed measuring the same degree of SQ using height as when we perform subjective, multifactorial judgments. These results also validate the accuracy of the sonic criteria used and our capabilities in making subjective judgments. With enough repetitions of both height and subjective SQ assessment conducted on separate days, one can establish mean and standard errors for both methods, and hence reproducibility. Assuming this data consistently shows parallelism, one can extrapolate between the two semi-log plots from height measurements to subjective SQ points. This saves time and controls for day-to-day physiological/neurological variations in subjective judgments.
Height measurement has proven to be a far easier, quicker, and more objective method to estimate audio quality than other techniques we have used. As far as we know, this is a totally new and quantifiable method for assessing SQ and has the advantage of being more consistent over longer periods of time. The benefit of this method is that it allows the listener to make comparable judgments from one listening session to the next even when such listening sessions are days apart. In addition, this method is more resistant to mental fatigue and confusion when performing extended A/B comparisons.
Naturally, there could be some room limitations to this height method of estimating SQ. For example, in System 1 the height of the drop ceiling is 7′. In the case of the Chabrier (harp) and Misa Criolla (sopranos in chorus) test tracks, once the height exceeds the interface between the wall and ceiling, the height imaging folds forward along the ceiling towards the listener. Under the conditions of these experiments the sopranos can fold forward by as much as 36 inches. In order to ascertain what the maximum height might actually be, we tested the Misa Criolla track on a system using B&W Signature Diamonds in a high-resolution system (judged to be similar to the sound in System 1) located in a great room with a two story high ceiling. The maximum height of the chorus observed in this room was approximately 100″ above the floor and about 70″ above the center of the semi-logarithmically as we did for the results in Figure 2, we also obtained a linear relationship, with very similar slopes. Representative examples of such results are shown in Figure 3.

It is noteworthy that all four slopes derived from the Acousence recording are quite similar to each other as well as remarkably similar to those shown in Figure 2B. The degree of similarity Signature Diamond midrange driver. In System 1, the maximum height of the choir calculated as the ceiling height plus the distance folded forward along the ceiling was 120″ and about 72″ above the center of the 802 Diamond midrange driver. It is interesting the degree to which these two measures of height agree when normalized to the midrange height for each speaker. We thought at the time that this might be mere coincidence. However, in recent experiments (to be reported in a future article) it appears that adding the distance to the ceiling plus the distance forward into the room along the ceiling does give a valid indication of the true maximum height of the highest choir members, the sopranos. So far, with even more tweaks to our systems, we have observed a maximum forward projection of 82 inches. (We have recently commissioned experimental recordings designed to enable us to make real-world-accurate height measurements. These recordings have taught us that microphone placement can distort actual height reproduction; thus we cannot know the true vertical location of the sopranos in Misa Criolla even if they were on typical risers behind the soloist.) The ability to portray height is not confined to the Bowers and Wilkins speakers. We found it can be heard with different combinations of speaker types and listening rooms, such as in System 2 using Paradigm speakers, in a fourth system using Quad 2905 electrostatic speakers, and two additional locales with Infinity IRS V speakers and Roger Sanders electrostatic speakers in which vertical height was not room limited.
Ultimately, the reality of the performance itself and the manner in which microphones accurately capture the vertical dimension dictates the valid upper limit of height estimates. Therefore, if one wishes to use height measurements to compare equipment or system tweaks, the performance of the system must be configured so that the range of differences falls within the height limits of the recording itself. This problem can be solved by sonically handicapping the system. For example a lower-quality power cord could be inserted or one set of support footers could be removed. Under these conditions you can then use height to measure the variable under test. The fifth track in the Misa Criolla recording turns out to have captured the greatest height information we have yet found. For this reason we have gradually shifted from using the harp in the Acousence track to the sopranos in Misa Criolla and this will be reflected in the measurement applications in Part 2 of this three-part series.
There is at least one additional variable that must be considered. We ran these height tests with seven different experienced listeners. While all listeners could discern height differences, there were significant differences in the absolute maximum height estimates among them. Two obvious variables that can affect audible perception are pinna shape and ear canal diameter. In the latter case, it is known that the diameter of the auditory canal determines its resonant frequency. Exactly which frequencies are emphasized (or amplified) may well determine in a given individual the hearing acuity of different midrange frequencies, thus affecting sensitivity to subtle midrange differences. So clearly we must remain cautious in predicting whether everyone can replicate our results to the same quantitative extent. In other words, depending on system and hearing acuity, your mileage may vary.
In Part 2 in Issue 248 we will continue exploration of our sonic measurement system as we apply this methodology to demonstrate the magnitude of three different influences on system SQ. Then in Part 3, we apply both our objective and subjective techniques to resolve the question of Mac versus PC SQ.


By Jay Clawson
More articles from this editor

Read Next From Review
See all

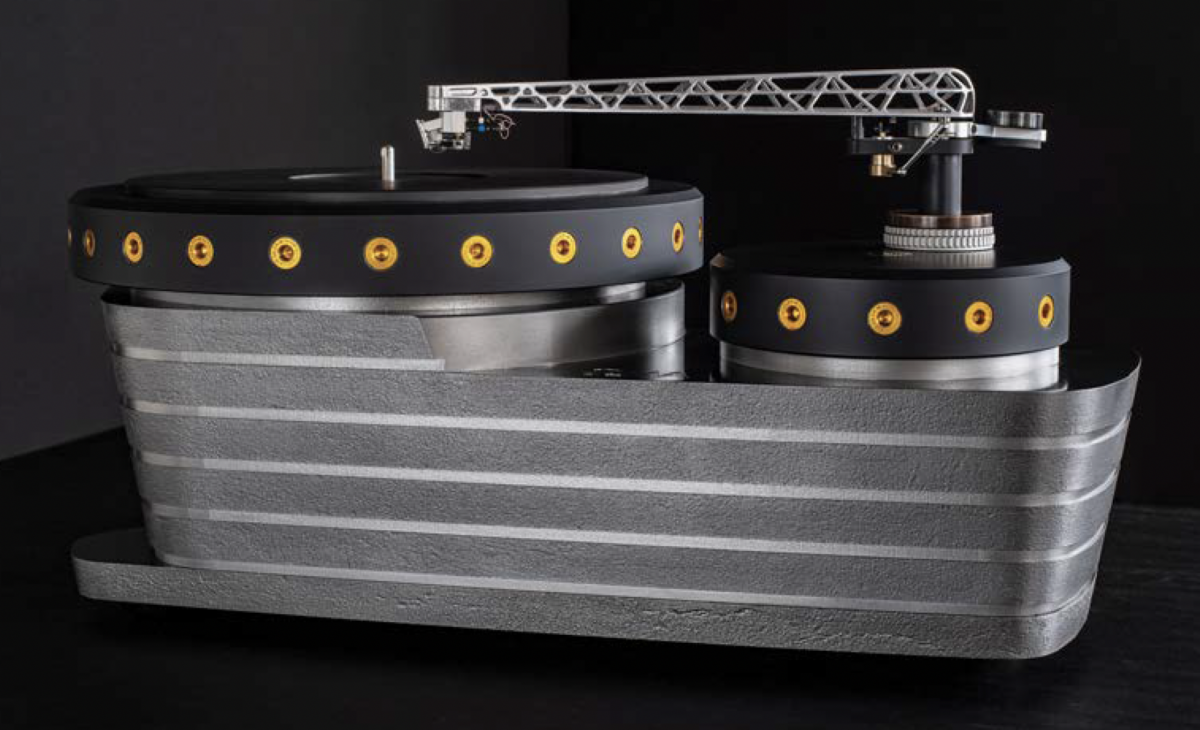
Oswalds Mill Audio K3 Turntable
- Apr 12, 2024
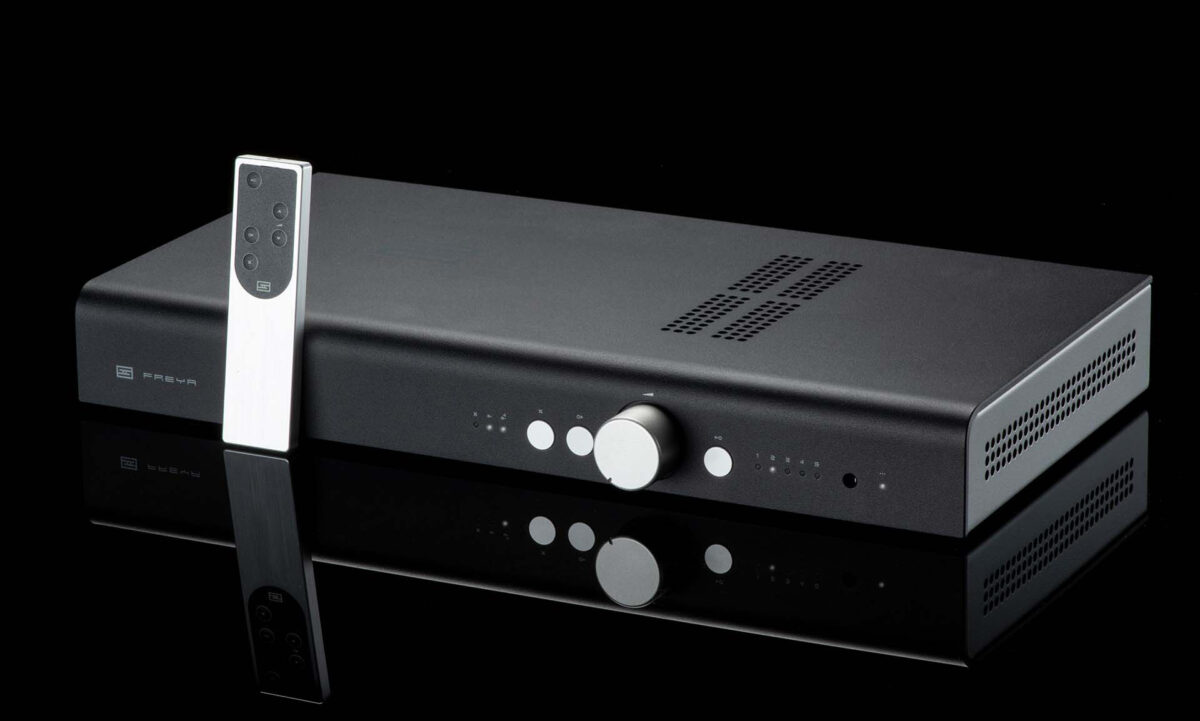
2023 Golden Ear: Schiit Freya S Preamplifier
- Apr 12, 2024